Sound familiar?
You built the app in Cursor. It works. Your own customers use it every day and nobody complains about speed, because nobody has more than a few hundred records. Then a bigger customer says yes to a pilot, and their data is a hundred times larger than anything you have loaded.
The first demo goes fine because you show them your data. The second demo is on theirs. The list page spins. You say "we'll add caching".
You are now the CTO of a company whose main page takes fifteen seconds, and the person across the table has a deadline and two other vendors.
What they sent us
A leasing-broker tool: dealers submit vehicle lease applications, brokers price them, the lender's back office approves. Built in Cursor by a two-person team, in production for their own brokerage for about a year. Then it won a pilot with a bank's dealer partner network. The pilot brought 50,000 applications in one import, and the pilot manager gave the founder two weeks to prove the tool could carry them.
Discovery scanned 19 dimensions and scored the app 2.3 out of 5, "developing". The security and data findings were the usual ones. The finding that mattered for the pilot was scale.
On the founder's own data the applications list answered in 91.5 ms at the 95th percentile and the server took 205 requests a second. With the pilot's 50,000 rows loaded, the same endpoint took 15.8 s at p95 and the server managed 2.55 requests a second. Resident memory went from 220 MB to 842 MB and stayed there.
The cause was two endpoints and one process. The list endpoint ran SELECT * over every application the tenant owned, loaded all of them into Python objects, and sliced the page out of the list. The CSV export did the same, then joined the rows into one string before sending a byte. Both ran on a single synchronous worker, so one export blocked every other user for as long as it took, and two exports blocked the server for twice as long.
There was no load test, no CI, and no number anyone could put in front of the pilot manager. The founder had a hunch that the page was slow on big data. The hunch was correct, and it was worth nothing in a procurement meeting.
What would have happened
What actually happens
Day 3 of the pilot: the second demo, to the dealer network's operations lead, on their data. The applications page takes fifteen seconds. Someone on the call starts an export; the page for everyone else stops answering until it finishes. The founder says "we'll add caching".
Day 5: the pilot manager replies with one line, "please send your load-test report". There is none. Day 12: procurement asks the same question in writing, because the security questionnaire has a performance section and the answer field is empty.
Day 14: the two weeks are up. The pilot slot goes to the incumbent vendor with the worse product and the completed questionnaire. Pilots are lost on the second slow demo, not the first, and this bank's partner network does not run a second pilot with the same vendor for a long time.
Forty-eight hours
Hour 0–6. First we made the problem reproducible, because a slow page you cannot reproduce on demand is a rumour. A seed script generated 50,000 applications across the pilot's dealers, and a first k6 script confirmed the Discovery numbers within a few percent.
Then we read the list endpoint. It had no LIMIT, no index on the sort column, and a pagination query parameter that the code accepted and ignored.
We replaced it with keyset pagination. Instead of an offset, the client sends the last row it saw, and the database seeks straight to the next 50 rows using a composite index. The cost of page 900 is the same as page 1.
-- first page
SELECT id, created_at, dealer_id, status, amount
FROM applications WHERE tenant_id = $1
ORDER BY created_at DESC, id DESC LIMIT 50;

-- next page: the client sends the last row's (created_at, id)
SELECT id, created_at, dealer_id, status, amount
FROM applications WHERE tenant_id = $1
  AND (created_at, id) < ($2, $3)
ORDER BY created_at DESC, id DESC LIMIT 50;

-- CREATE INDEX ... ON applications (tenant_id, created_at DESC, id DESC);
The row tuple comparison is the whole trick: Postgres compares (created_at, id) as one value, so ties on the timestamp still page correctly, and the index covers the seek. The API returns the cursor as an opaque string. A page size above 200, or an unknown query parameter, returns 422 before any query runs; our reviewers reject endpoints that validate after the database has already done the work.
Hour 6–18. The export. Building a 50,000-row CSV as one string is what pushed memory to 842 MB, and doing it on the only worker is what made everyone else wait. We rewrote it as a streamed response over a server-side cursor that fetches 2,000 rows at a time, so memory stays flat regardless of the file size.
The first version passed our tests and was rejected in review: nothing stopped ten users from starting ten exports at once. The second version holds a small semaphore and answers 429 with a Retry-After header when the slots are full.
EXPORT_SLOTS = threading.BoundedSemaphore(2)   # per web process

def export_csv(tenant_id):
    if not EXPORT_SLOTS.acquire(blocking=False):
        return Response(status=429, headers={"Retry-After": "30"})
    def rows():
        try:
            yield "id,created_at,dealer,status,amount\n"
            for r in iter_applications(tenant_id, batch=2000):  # server-side cursor
                yield f"{r.id},{r.created_at},{r.dealer},{r.status},{r.amount}\n"
        finally: EXPORT_SLOTS.release()
    return Response(rows(), mimetype="text/csv")
The slot is released in the generator's finally, so a client that disconnects halfway gives its slot back. A third concurrent export gets a 429 in under a millisecond instead of a fifteen-second wait, and the front end shows "export busy, retrying in 30 s". The same hour, the app moved from one worker to two web workers behind the reverse proxy, which is the number the host's memory allowed with headroom.
Hour 18–36. Everything that had no business inside a web request left it: the bulk import from the lender's file, the nightly dealer statements, PDF generation for approved applications. They became rows in a jobs table and a separate worker process claims them. The claim is one statement, and SKIP LOCKED is what lets a second worker run next to the first without both taking the same job.
UPDATE jobs SET state = 'running', started_at = now(), worker = $1
WHERE id = (
  SELECT id FROM jobs
  WHERE state = 'queued' AND run_after <= now()
  ORDER BY run_after, id
  FOR UPDATE SKIP LOCKED
  LIMIT 1
)
RETURNING id, kind, payload;
No queue broker, no new infrastructure to run; the database the team already operates is the queue. The worker writes a heartbeat row every few seconds, and the /ready endpoint now checks the database, the migration head and that heartbeat. If the worker dies, the load balancer knows before a customer does. The first version scheduled the worker with cron inside the container; it failed silently as a non-root user, so the loop moved in-process where the readiness check can see it.
Hour 36–48. The gate. A fast page is an observation; a gate is a promise. We wrote the k6 scenario to match the pilot's shape: 50,000 seeded applications, 20 iterations a second for 300 seconds steady, between 20 and 50 virtual users, logins capped at 30 a minute the way the lockout rule would cap them in production.
A 30-second warm-up runs first and is excluded from the thresholds. Tokens come from k6's setup(), so no virtual user logs in on the hot path and the numbers measure the app, not the password hash.
thresholds: {
  "http_req_duration{gated:yes}": ["p(95)<500"],
  "http_req_failed{gated:yes}":   ["rate<0.01"],
  functional_failures:            ["count<1"],   // a 200 that did no work
},
scenarios: {
  warmup: { executor: "constant-arrival-rate", rate: 20, timeUnit: "1s",
            duration: "30s", preAllocatedVUs: 20, tags: { gated: "no" } },
  steady: { executor: "constant-arrival-rate", rate: 20, timeUnit: "1s",
            startTime: "30s", duration: "300s", preAllocatedVUs: 20, maxVUs: 50 },
}
Three thresholds. p95 under 500 ms, because that is the number in the bank's questionnaire. Errors under 1 %.
And zero functional failures, which is our own counter: each request checks that the response actually did the work, so a 200 with an empty page or a "try again later" body counts as a failure. The first gate went green on exit code alone; a reviewer rejected it for exactly that, and the raw k6 summary is now kept and hashed with every run.
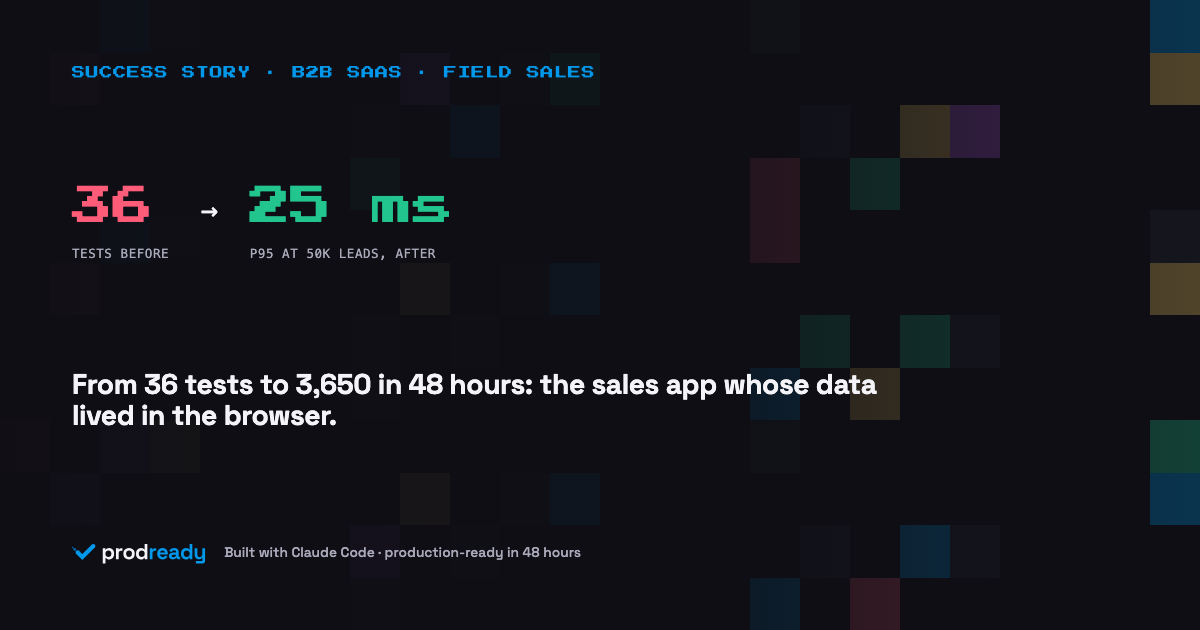
The gate run that closed the 48 hours: 9,171 gated requests, p95 25.46 ms, p99 40 ms, 0 errors, 0 functional failures. It runs in CI on every merge and fails the build when it fails. Every  prodready delivery ships with a gate like this, tuned to the customer's numbers. That summary, with the thresholds and the run hash, is the document the pilot manager asked for.
The pilot manager didn't want a faster page. He wanted a document that said it would still be fast next year. We got both.
What it looks like now
The architecture is not exotic. Two web workers behind a TLS proxy, Postgres, and one job worker that claims from a table. What changed is that no request can take longer than the page it serves, no export can hold the server, and the whole thing is measured under the pilot's load on every merge.
| Measured at 50,000 applications | Before | After |
|---|---|---|
| Applications list, p95 | 15.8 s | 25.46 ms |
| Applications list, p99 | not measured | 40 ms |
| Throughput under load | 2.55 requests/s | 9,171 requests in 300 s, 0 errors |
| Web process memory | 220 MB, then 842 MB | flat; export streams 2,000 rows at a time |
| Concurrent exports | unbounded, each blocks the server | 2 per process, then 429 with Retry-After |
| Long-running work | inside web requests | jobs table, worker with SKIP LOCKED, heartbeat in /ready |
| Load test | none | k6 gate in CI, 3 thresholds, summary hashed |
| Readiness score | 2.3 / 5 | 3.8 / 5 |
From our desk
The first k6 gate passed. It passed because k6 only fails on its own thresholds and every response was a 200. Some of those 200s were the login throttle politely telling a virtual user it was locked out, with a JSON body and no data.
The reviewer who caught it wrote one sentence: "a 200 that didn't do the work is a failure". The functional_failures counter exists because of that sentence, and it is the threshold the pilot manager asked the most questions about.
Do this tonight
Do this tonight
1. Load the customer's size, not yours. On a local copy, insert 50,000 rows into your biggest table with INSERT ... SELECT ... FROM generate_series(1, 50000), then time the list page: curl -s -o /dev/null -w "%{time_total} %{size_download}\n" -H "Authorization: Bearer $TOKEN" http://localhost:8000/api/applications.
Over one second, or over one megabyte, is a page that loads everything.
2. Find the unbounded queries. Run grep -rnE "\.all\(\)|findMany\(|OFFSET|SELECT \*" src/. Every hit that serves a list endpoint without a LIMIT is a fifteen-second page waiting for a customer.
Ask Cursor to list every route that returns an array and whether it is paged; check its answer against the grep.
3. Start two exports at once. Open the export in two browser tabs, click both, and watch docker stats or top. If memory climbs and does not come back down, the file is being built in RAM.
If a third tab's normal page load stalls until the exports finish, you have one worker and no cap.
Those three checks tell you whether you have the problem. They do not give you the numbers under five minutes of sustained load, the gate that stops the next commit from putting the problem back, or the report an enterprise procurement team will accept in place of "we'll add caching".
The rule
The rule
A page that takes 90 ms on your data has not been tested. Test it at the size of the customer you want, then put that test where it can fail the build.
The pilot manager didn't want a faster page. He wanted a document that said it would still be fast next year. We got both.— CTO-founder